
Student name
Capella University
RSCH-FPX7864 Quantitative Design and Analysis
Professor Name
Submission Date
Descriptive Statistics
Figure 1
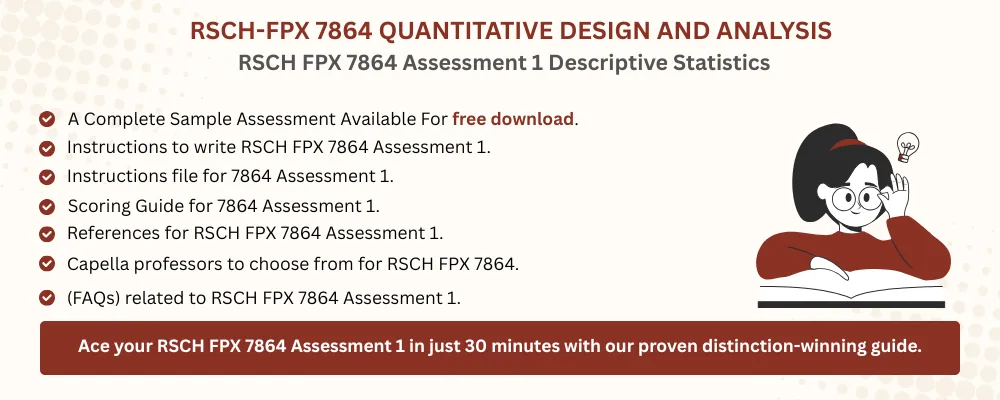
Descriptive Statistics
Descriptive statistics make a comparison of the upper and lower divisions in terms of mean, standard deviation, and range. The mean of the upper division is M = 62.161, and that of the lower division is M = 61.469. There is more variability in the standard deviation, and the low division has SD=8.595. The standard deviation in the upper division is SD = 6.747. The scores are between 40 and 75 (Cooksey, 2020). The statistics show that the upper division is a little higher than the lower division in the mean, but the latter is more differentiated.
Figure 2
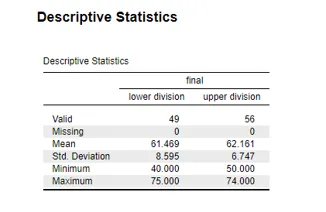
Lower Division
A histogram represents the distribution of scores of 49 students in the lower divisions in the final exam. The independent variable is the final exam, and the dependent variable is the lower division. The level of scores is 40-75, with a 5-point gap in between (e.g., 50-55, 70-75). The majority of the outcomes lie between 60 and 65. Two students rated 40 to 45, three 45 to 50, and eight 50 to 55. There are seven students in the range of 55-60, twelve students in the range of 60-65, seven students in the range of 65-70, and ten students in the range of 70-75. The skewness is left-skewed as the distribution has a longer left tail (Pajankar, 2021). The skewed leftward median is supported by the high median of 62.5 with a mean of 61.469.
Figure 3
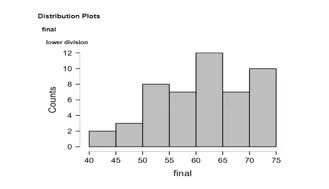
Upper Division
The data used is a histogram of the end of exam score of 56 upper-division students. The independent variable is exam scores, and the dependent variable is the upper division. Scores range from 50 to 75. There were 11 students with a score of 50-55, and 12 students with a score of 55-60. The ranges of 60-65, 65-70, and 70-75 have 14, 13, and 6 students, respectively. The majority of the students scored 60-65. The histogram takes the shape of a bell, which means it is in a normal distribution (Pajankar, 2021). The mean is 62.161, and the median is 62.5. The proximity of the mean and the median is a confirmation of the normal distribution of data.
Data Set Interpretation
Part 2
Figure 4
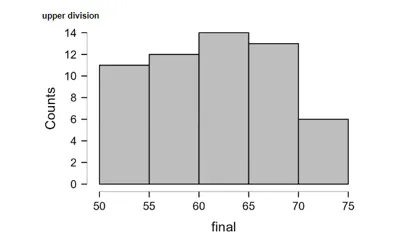
Descriptive Statistics
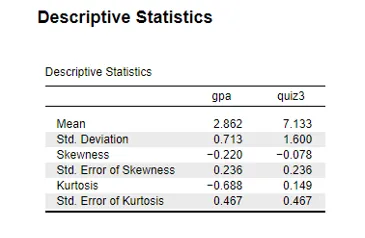
Interpretation of Results
The data set consists of mean (M), standard deviation (SD), GPA, and quiz 3 scores. Student performance was measured by using descriptive statistics. The average score is the mean, and the standard deviation is the measure of variability (Darling, 2022). The mean and standard deviation of the GPA are M= 2.862 and SD= 0.713. The mean of Quiz 3 = M= 7.133 and SD= 1.600. GPA and Quiz 3 are slightly skewed to the negative. The GPA skew is -0.220; Quiz 3 skewness is -0.078. Negative skew refers to the fact that the data are concentrated on the left side with the longer tail (Berger and Kiefer, 2021). GPA Kurtosis = -0.688, quiz 3 kurtosis = 0.149. The values of kurtosis indicate that the distributions are flatter as compared to the normal distribution (Berger and Kiefer, 2021). The kurtosis of Quiz 3 is less than that of a normal distribution.
Skewness and Kurtosis Distribution
Skewness that falls between -1 and +1 and kurtosis between -2 and +2 are the signs of normality of a data set. The assumption of normality may usually be accepted when the values of the descriptive statistics do not exceed the ranges (Hatem et al., 2022). The skew of the GPA is -0.220, which is a slight left skewness, and it is within normal values in that it is within the range of -1 to +1, and hence the distribution is said to be approximately symmetric (within the range of -1 to +1). The skewness of Quiz 3 = -0.078, which is quite near the value of zero, and it means a nearly symmetric distribution (Church et al., 2019). Both the skew values are within reasonable levels, and this means that there is no skewness in the distribution. The kurtosis of the GPA is negative (-0.688), which is slightly less than the normal distribution figure. Quiz 3: Kurtosis = 0.149, which means that the distribution is not far from normal. All the values are within the acceptable range of -2 to +2, implying that there is normality. Thus, both GPA and Quiz 3 sample satisfy the normality assumptions.