

- MATH 1300 Module 6 Assignment 2 Chi-square analysis.
Chi-square analysis
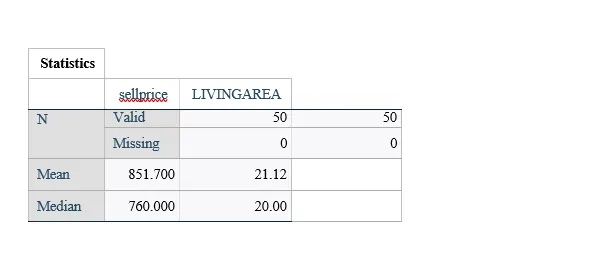
Based on the given data uploaded, change the variable sale price into two categories: above the mean price or not, and change the living area into two categories: above the median living area or not. Using the resulting variables, will you conclude that a larger house corresponds to a higher price?
Hypotheses
The null and the alternative hypotheses are given by
H0: There is no association between the Sale Price and the Living Area.
Ha: There is an association between Sale Price and Living Area.
MATH 1300 Module 6 Assignment 2 Chi-square analysis
P-Value
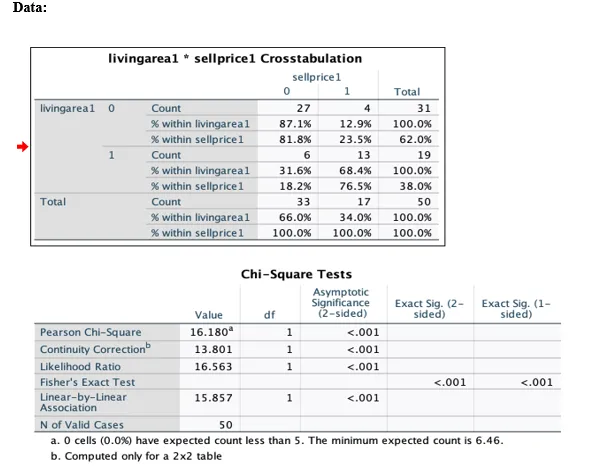
From the Chi-Square test results, the p-value is:
p=<.001 <0.05, reject H0
Which is lower than 0.05 and confirms the significance of the result.
The data shows an association between sales prices and living areas. The cross-tabulation chart shows that 81.8% of homes sold under the mean price had a living area below the median, while 76.5% of homes sold above the mean price had a living area above the median.
Conclusion
There is evidence that “Price” and “Living Area” are associated, so we can conclude that variables “Sell Price” and “Living Area” are associated, where a greater sale price is associated with a larger living area. We reject the null hypothesis.