

RSCH FPX 7864 Assessment 4 Data Analysis And Application Template
Student Name
Capella University
RSCH-FPX 7864 Quantitative Design and Analysis
Professor Name
Date
ANOVA Application and Interpretation
The statistical method Analysis of Variance (ANOVA) enables researchers to evaluate mean variations in independent group samples with three or more groups. Despite the usefulness, ANOVA has limitations, such as the inability to identify which specific groups differ, and requires data that is normally distributed and has equal variances across groups (Alem, 2020). Tukey’s post-hoc tests were applied to analyze mean score differences that became evident during the study. The research used a one-way ANOVA to evaluate differences in Quiz 3 scores between different class sections and determine how section alignment affects student results.
Data Analysis Plan
In the analysis, the variables used are:
- Class Section – Categorical variable (e.g., Section A, Section B).
- Quiz 3 (Number of correct answers) – Continuous variable (e.g., scores on Quiz 3).
Research Question
Is there a significant difference in the mean Quiz 3 scores among different class sections?
Null Hypothesis (H₀)
There is no significant difference in the mean Quiz 3 scores among the class sections.
Alternate Hypothesis (H₁)
There is a significant difference in the mean Quiz 3 scores across the class sections.
Testing Assumptions
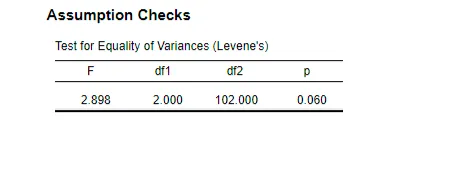
Levene’s test examines if different population groups possess equal variances since this is an essential condition for ANOVA. In the analysis, the test produced an F value of 2.898 with degrees of freedom df1 = 2 and df2 = 102, yielding a p-value of 0.060 (F = 2.898, p = 0.060). The calculated p-value surpasses 0.05, which keeps the null hypothesis intact since p > 0.05. The analysis confirms equal variance distributions between the groups, which fulfills the required assumptions for testing the homogeneity of variances. The ANOVA analysis can progress because the necessary test assumption is met (Zhou et al., 2023). The ANOVA reliability is established because the same variances exist across groups based on Levene’s Test results, which reduces potential result biases.
Results & Interpretation
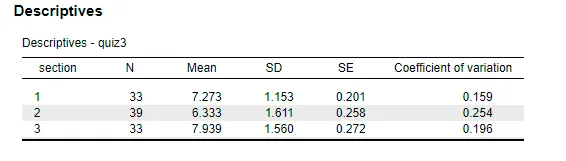
The data collected in Quiz 3 displays substantial variations regarding the average scores and statistical dispersion rates across different assessment sections. Section 1 had a mean score of M = 7.237 with a standard deviation of SD= 1.153, indicating consistent performance with relatively low variation. Section 2, however, had a lower mean of M = 6.333 and a higher standard deviation of SD= 1.611, suggesting greater variability and less uniformity in student performance. Section 3 achieved the highest mean of M = 7.939, with a standard deviation of SD= 1.560, demonstrating strong overall performance, though there was some variability in individual results. The descriptive statistics present average score differences and section consistency, which provides a detailed understanding of how all groups performed in Quiz 3.
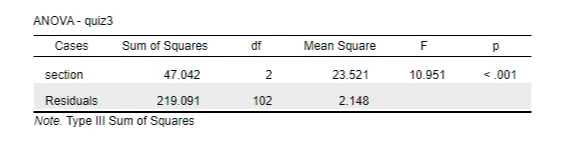
The F-test functions within ANOVA to assess the between-group variations of means and within-group variability. The calculated F-statistic value was F(2,102) = 10.951 while the p-value demonstrated higher significance below 0.001 (p <0.001). The data analysis rejects the null hypothesis because section variables demonstrate varying average quiz results on Quiz 3. The analysis results confirmed constant variances between sections because the homogeneity of variances assumption was met (Zhou et al., 2023). The research shows that test performance on Quiz 3 ties directly to the academic section of enrolled students. The study demonstrates how institutions should examine group performance metrics since the knowledge leads to constructing better support structures for every student.
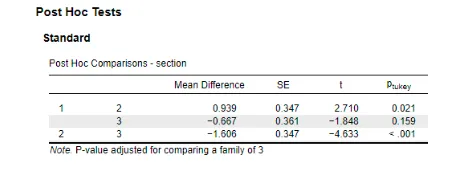
The ANOVA results demonstrated a significant impact of class section on Quiz 3 scores, prompting the use of a Tukey post-hoc test to identify specific performance differences between sections. The findings were as follows:
- Sections 1 vs. 2: Section 1 scored an average of 0.939 points higher than Section 2, with a SD= 0.347. The statistical test produced a t = 2.23, p = 0.0021, indicating that Section 1 students significantly outperformed those in Section 2. This suggests that certain factors in Section 1 may contribute to better performance on the quiz compared to Section 2
- Sections 1 vs. 3: The comparison between Sections 1 and 3 showed a mean difference of -0.667 points, with SD= 0.361. The resulting t = -1.848, p = 0.159 indicated no significant difference in scores, suggesting that Sections 1 and 3 performed similarly on the quiz.
- Sections 2 vs. 3: Section 3 outperformed Section 2 by a mean difference of 1.06 points, with Section 3’s scores being significantly higher. An SD= 0.347 resulted in t = -4.633 and p < 0.001 (t = -1.606, p = -4.633), indicating a strong statistical significance, highlighting the advantages of Section 3’s instructional approach or resources.
While Sections 1 and 3 had comparable results, both outperformed Section 2, underscoring the importance of analyzing group-level differences in educational assessments to identify key performance trends.
Statistical Conclusions
In the study, a one-way ANOVA was utilized to examine variations in Quiz 3 scores across different class sections. Before conducting the ANOVA, Levene’s test was performed to evaluate the homogeneity of variances. The results confirmed that the assumption of equal variances was satisfied, validating the use of ANOVA for the analysis. The ANOVA produced a significant F-statistic (F(2, 102) = 10.951, p < 0.001), demonstrating that the average scores on Quiz 3 varied significantly among the class sections. The outcome led to the rejection of the null hypothesis, indicating that class section significantly influences Quiz 3 performance and necessitating further exploration of group differences through post-hoc analysis.
To identify specific group differences, a Tukey post-hoc test was performed, and the results revealed the following:
- Section 1 vs. Section 2: Students in Section 1 performed significantly better than those in Section 2, with a mean difference of 0.939 (p = 0.021). This suggests that factors specific to Section 1, such as teaching methods or classroom dynamics, might have contributed to higher performance.
- Section 2 vs. Section 3: Section 3 outperformed Section 2 significantly, with a mean difference of -1.606 (p < 0.001), revealing a pronounced performance disparity. The results imply that Section 3 may benefit from unique teaching strategies or favorable learning conditions.
- Section 1 vs. Section 3: No significant difference was observed between Sections 1 and 3, with a mean difference of -0.667 (p = 0.159). The sections demonstrate comparable effectiveness and environmental conditions that lead to successful performance among students.
Section 1 and Section 3 demonstrated superior results than Section 2, and the scores remained equivalent. Results show that the formation of class sections directly affects student quiz results, thus creating opportunities to develop better educational strategies, which result in uniform student achievement throughout all sections.
Limitations and Possible Alternative
The one-way ANOVA is a practical statistical evaluation of group mean variations, yet certain restrictions limit interpreting the results. The ANOVA shows significant differences between groups, which cannot precisely identify which groups differ. Using Tukey’s test as a post-hoc analysis solves the ambiguity in ANOVA results (Alem, 2020). The ANOVA demands equal variances across groups even though the assumption becomes unreliable for different sample group sizes. A fundamental violation of the condition will result in incorrect analysis outcomes. Alternative theories about observed variations should receive attention since variables unrelated to the analysis might affect the results (Kang, 2021). Therefore, while ANOVA is useful for identifying overall group differences, careful consideration of the limitations and appropriate post-hoc tests are essential for accurate interpretation.
Application
A beneficial examination in myology would be the use of muscle training regimens as the independent variable, with resistance and aerobic training and the combination as the three categories. The muscle strength and hypertrophy parameters are the dependent variables for research, measuring the observed changes in muscle mass and force production (Hayashida et al., 2024). Myology needs analysis to determine which training approaches produce optimal muscle enlargement and strength development, which can optimize exercise protocols for athletes, mature adults, and patients dealing with muscle conditions (Trombetti et al., 2021). Researchers discover optimal strategies for enhancing muscle function together with prevention techniques for muscle atrophy and recovery protocols after injuries through studies on different workout regimens.