

Report: Selling Price and Area Analysis for D.M. Pan National Real Estate Company
Student Name
University
Introduction
This report will examine the relationship between the selling price of properties and their size in square footage within the Northeast Region of the United States. I have selected this region because it is close to where I live and will give us an innovative idea of how much houses are being sold for. The following will explain the findings of my research.
Representative Data Sample
DESCRIPTIVE STATISTICS
| Listing Price | $ per sq. ft. | sq. ft. | |
| Mean | $302,964.52 | $184.90 | 1,657 |
| Median | $306,900.00 | $179.00 | 1,610 |
| Standard Deviation | $36,380.34 | $20.57 | 261.6413165 |
Data Analysis
When we compare our findings to the National Summary Statistics, we will see that the Mean of Listing Prices for the Northeast Region is $302,964.52, as compared to the National mean of A difference of $39,400, the Northeast is less money for a listing price, with the total of $342,365.00. The difference between the Northeast region median $ per sq.ft and the National average is $13.00.The Northeast region median is $179.00 vs. the National average of $166.00. We do see that the dollar per square foot is not that much different between the two, but it is more in the Northeast region. The Median (average) listing price for the Northeast region is $306,900.00, and the national average is $318,000.00, which is a difference of $11,100.00 between the two. The average amount of money on the listing price in the northeast region is less.
To make sure that the samples were random, I used a formula that generates a random number from 0 to 1; =RAND(. In the formula that generated my random number list, I used all 100 data cells for the Northeast Region. Then made a row of fixed random numbers by copying and pasting the random numbers without using the formula. I then sorted the results and selected the top 30 samples on the list, and made sure that no sample was selected more than once and that the samples were chosen at random.
Scatterplot
The Pattern
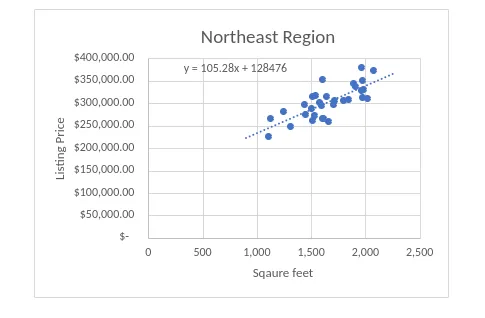
X variable is the square feet of the house, and Y is the Listing price of the house. The listing price of a house is the most useful number with which to make predictions because what we are trying to predict is the average price of a house in the Northeast region. With such variables, we can
Figure that out. The X and Y variables show there is a positive correlation between the two. It is clear from the scatter graph that as the value of x increases, the value of y increases as well. As the house gets bigger (X-axis), it costs more (Y-axis) to list the house. The scatter plot shows a strong, positive linear relationship.
The house would be listed at $317,980.00 if I had a house that is 1,800 square feet in the northeast region,n and wanted to know what to list it for, to figure it out, my answer would be y=105.28 x 1800 + 128476. And that would be a perfect fit for the area, according to the scatter plot.