

- MBA FPX 5008 Assessment 2 Using Analytical Techniques to Add Meaning to Data
Using Analytical Techniques to Add Meaning to Data
Business analytics is an important weapon in the analytical process of evolving necessary data into useful data that helps organizations make sound decisions (Smith, 2022). Based on this, the present report mainly captures an analytical study of the stock data relating to NVIDIA Corporation, which is a semiconductor company known globally with specialties in GPUs and technologies associated with it.
This type of analysis is based on the use of graphs and the use of descriptive statistics, to show a detailed picture of NVIDIA Corp’s stock performance for the last year It will be useful for any NVIDIA Corp stakeholder and will help the company focus its attention on certain areas for further improvement of its strategic decisions.
Company Overview
This company was Founded in 1993, NVIDIA Corporation has grown to be one of the key players in the semiconductor market, especially within the GPU segment, for a broad spectrum of uses (NVIDIA, 2023). The company offers business across several segments that include gaming, data center, professional visualization, and automotive.
This is because NVIDIA’s GPUs are intermediate gaming and industries like AI and data analytics and self-driving cars, which gives it a competitive edge over competitors like AMD and Intel. Technological advancement, partnering with other companies, and establishing brand identity and image put NVIDIA in a strategic place to dominate the GPU market for GPUs as the market evolves.
Graphical Representations of Data
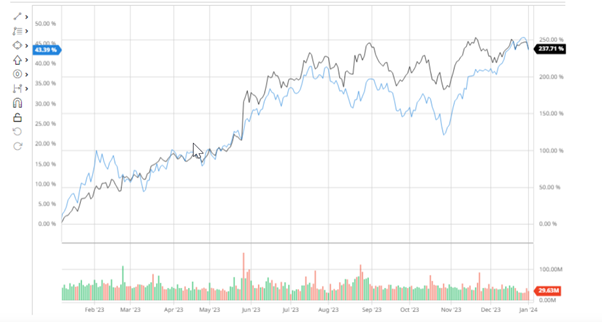
To help the user understand the situation with the stock of NVIDIA company, we have prepared scatter plots and histograms using historical data on stock quotations available on the Yahoo Finance website. The scatter plot shows the maximum and minimum value of the stock price for one year as it demonstrates the flow of the specific firm’s stocks and any changes in its stock price (Yahoo Finance, 2023).
This histogram shows the closed prices’ distribution as it depicts the proportional variation of the price within a certain period by analyzing the daily closing stock prices. Likewise, in analyzing market dynamics, especially about NVIDIA’s stocks, it is necessary to learn about the trading frequency or volume, and a histogram gives this information.
Descriptive Statistics
Analysing the gathered data we were calculating basic statistics measuring NVIDIA’s stock data. The arithmetic average, median, mode, and standard deviation were computed based on the stocks ‘Adjusted Daily Closing price and the stock’s trading volume. Such measures of central tendency and variability give quantitative expressions of stock performance measurements of the NVIDIA firm (Smith 2022).
All these give stakeholders accurate information needed to assess the averages, volatility, and activity in the stock market for the particular stock to be able to make sound decisions when it comes to risk assessment and investment.

Summary of Findings
Analyzing the data set allows us to show several findings about NVIDIA’s stock performance and market dynamics. Most of the points on the scatter plots are distinctly elevated above or below the middle line which denotes high variability in the highest and lowest stock prices some of the times of the year (Yahoo Finance, 2023).
MBA FPX 5008 Assessment 2 Using Analytical Techniques to Add Meaning to Data
Line graphs of the first adjusted daily closing prices and trading volume exhibit trends that highlight fluctuations in market activity. The observations above are supported by descriptive statistics which provide concrete numbers regarding the average performance and dispersion in the prices of stocks and volumes of trades. All in all, the results lend support to the idea that NVIDIA is capable of sustaining the August performance in the face of the given market conditions spurred by technology penetration and positioning in a leveraged market.
Conclusion
By depicting the price of NVIDIA stock through graphical analysis and presenting the mean, standard deviation, coefficient of variation, minimum, and maximum values, the overall performance of NVIDIA and the fluctuations within the stock market over the past year are well understood.
By using these matrices, various stakeholders, such as investors and management, get useful knowledge for decision-making and strategizing (NVIDIA, 2023). Through the analysis of raw data utilizing analytical tools appropriately in this report, the conclusions drawn help to improve the information comprehensibility and facilitate relevant action in NVIDIA and beyond. Read more about our sample MBA FPX 5008 Assessment 1 Reacting to Market Volatility for complete information about this class.
References
Dash, S., Shakyawar, S. K., Sharma, M., & Kaushik, S. (2019). Big data in healthcare: Management, analysis and future prospects. Journal of Big Data, 6(1), 1–25. springer.
https://doi.org/10.1186/s40537-019-0217-0
DePoy, E., & Gitlin, L. N. (2019). Introduction to research e-book: Understanding and applying multiple strategies. In Google Books. Elsevier Health Sciences.
a2NtAzw1LvVx4R0aPg&redir_esc=y#v=onepage&q&f=false
Gale, R. C., Wu, J., Erhardt, T., Bounthavong, M., Reardon, C. M., Damschroder, L. J., & Midboe, A. M. (2019). Comparison of rapid vs in-depth qualitative analytic methods from a process evaluation of academic detailing in the veterans health administration. Implementation Science, 14(1).
https://doi.org/10.1186/s13012-019-0853-y
Greenhalgh, T. (2019). How to read a paper: The basics of evidence-based medicine and healthcare. In Google Books. John Wiley & Sons.
Qic&redir_esc=y#v=onepage&q&f=false
Kohl, S., Schoenfelder, J., Fügener, A., & Brunner, J. O. (2018). The use of data envelopment analysis (DEA) in healthcare with a focus on hospitals. Health Care Management Science, 22(2), 245–286.
https://doi.org/10.1007/s10729-018-9436-8
Schüssler-Fiorenza Rose, S. M., Contrepois, K., Moneghetti, K. J., Zhou, W., Mishra, T., Mataraso, S., Dagan-Rosenfeld, O., Ganz, A. B., Dunn, J., Hornburg, D., Rego, S., Perelman, D., Ahadi, S., Sailani, M. R., Zhou, Y., Leopold, S. R., Chen, J., Ashland, M., Christle, J. W., & Avina, M. (2019). A longitudinal big data approach for precision health. Nature Medicine, 25(5), 792–804.