

Laboratory Techniques and Measurements
Hands-On Labs, Inc.
Version 42-0165-00-02
Lab Report Assistant
This document is not meant to be a substitute for a formal laboratory report. The Lab Report Assistant is nothing more than a summary of the questions for the experiment, diagrams (if necessary), and data tables that would be included in a formal lab report. The intent is to facilitate students’ writing of lab reports by providing this information in an editable file that can be sent to an instructor.
Exercise 1: Length, Temperature, and Mass
Data Table 1. Length Measurements.
Object | Length (cm) | Length (mm) | Length (m) |
CD or DVD | 18 cm | 180 mm | 0.18 m |
Key | 5 cm | 50 mm | 0.05 m |
Spoon | 21 cm | 210 mm | 0.21 m |
Fork | 15 cm | 150 mm | 0.15 m |
Data Table 2. Temperature Measurements.
Water | Temperature (°C) | Temperature (°F) | Temperature (K) |
Hot from tap | 34o C | 95o F | 308 K |
Boiling | 97°C | 209°F | 367.15 K |
Boiling for 5 minutes | 104°C | 218°F | 494 K |
Cold from tap | 16°C | 57°F | 287.15 K |
Ice water – 1 minute | 11°C | 49°F | 282.15 |
Ice water – 5 minutes | 5°C | 41°F | 278.15 K |
Data Table 3. Mass Measurements.
Object | Estimated Mass (g) | Actual Mass (g) | Actual mass (kg) |
Pen or pencil | 7g | 9g | 0.009 kg |
3 Pennies | 7.5 g | 7.5g | 0.0075 kg |
1 Quarter | 4 g | 5.7g | 0.0057 kg |
2 Quarters, 3 Dimes | 15 g | 18.2g | 0.0182 kg |
4 Dimes, 5 Pennies | 20 g | 22.1 g | 0.0221 kg |
3 Quarters, 1 Dime, 5 Pennies | 30 g | 32.6 | 0.0326 kg |
Key | 6.5 g | 7.4 | 0.0074 kg |
Key, 1 Quarter, 4 Pennies | 19.6 g | 23.1 | 0.0231 kg |
Questions
A. Water has a boiling point of 100°C at sea level. What might have caused the water in this experiment not to reach a boiling point of 100°C?
At sea level, water turns to boiling at 100°C. The higher the water above the sea level, the lower the boiling point will be due to the decreased amount of pressure. The boiling point will be higher than 100°C if the water is below sea level because of the increased pressure in the air.
B. While heating two different samples of water at sea level, one boils at 102°C and one boils at 99.2 °C. Calculate the percent error for each sample from the theoretical 100.0°C.
For the first sample, which boils at 102°C, the percent error is 2 percent. The percent error calculated for sample 2 which boils at 99.2 degrees Celsius, is – 0.8 percent.
Exercise 2: Volume and Density
Data Table 4. Liquid Measurements.
Mass A | Mass B | Mass B – A | ||||
Liquid | Volume (mL) | Graduated Cylinder (g) | Graduated Cylinder with liquid (g) | Liquid (g) | Density g/mL | % Error |
Water | 5.0 ml | 5.0 ml | 5.0 ml | 5.0 ml | 5.0 ml | 5.0 ml |
Isopropyl alcohol | 19.4 g | 19.4 g | 19.4 g | 19.4 g | 19.4 g | 19.4 g |
Data Table 5. Magnet – Measurement Method.
Object: | Mass (g) | Length (cm) | Width (cm) | Height (cm) | Volume (cm3) | Density (g/cm3) |
Magnet | 4 g | 2.5 cm | 0.25 cm | 0.25 cm | 0.16 cm3 | 25 g/cm3 |
Data Table 6. Displacement Method.
Object | Mass (g) | Initial volume of graduated cylinder (mL) | Final volume of graduated cylinder (mL) | Object Volume (mL) | Density (g/mL) |
Magnet | 4 g | 8 ml | 10 ml | 2 ml | 2g/ml |
Metal bolt | 7.6 g | 8 ml | 12 ml | 4 ml | 1.9g/ml |
Data Table 7. Archimedes’ method.
Object | Mass (g) | Mass of Displaced Water (g) | Volume of Displaced Water (mL) | Density (g/mL) |
Metal Bolt | 7.6 g | 117.5 g | 116.4 ml | 1.07g/ml |
Magnet | 4 g | 117.1 g | 116.4 ml | 1.04 g/ml |
Questions
A. A rectangular object has an unknown height, length, and width of 3.6 cm, 4.21 c,m and 1.17 cm, respectively. What is the density (in grams per milliliter) of this substance if the mass is 21.3 g?
** 1 gram = 1 cm 3.6 x 4.21 x 1.17 = 17.7 21.3g / 17.7mL = 1.2 g/mL the density is 1.2 mLml
A sample of gold (Au) has a mass of 26.15 g. If the theoretical density is 19.30 g/mL, what is the volume of the sample of gold?
** Volume = Mass/Density Volume- 26.15 g /19.30 g/mL = 1.4 mL
B. What will happen if you drop the object in the beaker rather than submerge the object when using Archimedes’ Principle method?
If you had dropped an object into the beaker rather than submerging the object, then the results that you obtained would have been If you had dropped an object into the beaker without the object being completely submerged, the results you obtained would have been could get the same as the volume of the object instead of the result based on the buoyancy.
C.What is the difference in the density measurement of the magnet done by Archimedes’ principle compared with the density measurement done by the calculated volume? Which procedure would be more reliable? Why?
Exercise 3: Concentration, Solution, and Dilution
Data Table 8. Initial Concentration.
Chemical | Mass of Volumetric Flask | Mass of Sugar (g) | Molar Mass (g) | Moles in Volumetric Flask | Total Volume (L) | Molarity (mol/L) |
Sugar (C12H22O11) | 27.3 | 8 | 342.296 g | 0.079755 | 0.025 | 3.1902 mol/L |
Data Table 9. Dilution Series.
Dilution | Volume (mL) | Mass (g) | Density (g/mL) | Initial Concentration (M) | Volume Transferred (mL) | Final Concentration (M) |
0 | 25.0 mL | 27.7g | 1.108g/mL | 0 mL | 3.1902 M | |
1 | 25.0 mL | 24.9g | 0.996g/mL | 3.1902 M | 2.5 mL | 0.31902 M |
2 | 25.0 mL | 25.4g | 0.984g/mL | 3.1902 M | 4.5 mL | 1.741444 M |
3 | 25.0 mL | 25.1 | 1.004g/mL | 3.1902 M | 3.0 mL | 2.612166 M |
4 | 25.0 mL | 25.6 | 1.024g/mL | 3.1902 M | 6.0 mL | 1.306083 M |
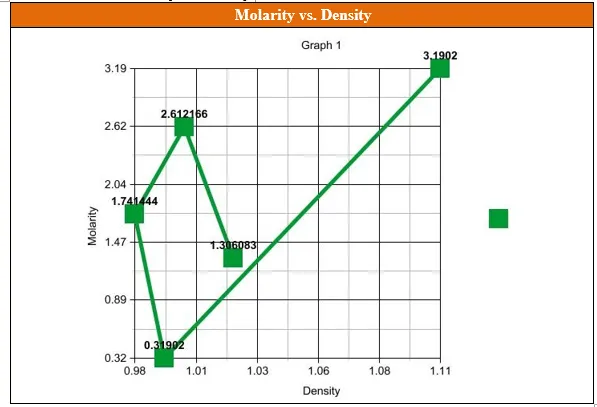
Data Table 10. Molarity vs. Density.
Questions
From the graph of Molarity vs. Density, (made in Data Table 10), what was the relationship between the molarity of the sugar solution and the density of the sugar solution? **As the sugar solution density decreased, the molarity decreased. It was also true that the opposite was true.