
Student Name
Walden University
ST3001 Assignment
Professor Name
Submission Date
Describing and Graphing Data
Part 1 — Identifying Variables in a Published Study
Chosen Study: Leighton, K., Kardong-Edgren, S., Schneidereith, T., Foisy-Doll, C., & Wuestney, K. A. (2021). Meeting undergraduate nursing students’ clinical needs. Nurse Educator, Publish Ahead of Print (46). https://doi.org/10.1097/nne.0000000000001064
In your own words, briefly describe the study and what it covered as if explaining it to someone who has not read the abstract information.
In this study, the undergraduate nursing students’ clinical learning needs were examined in terms of how well they were met in three different environments: Traditional Clinical Experiences (TCE), face-to-face simulation (F2FS), and screen-based simulation (SBS). As students’ livelihoods were disrupted during the COVID-19 pandemic, the researchers were driven to gain insight into what students thought of things when their usual schooling was suspended. The study examined students’ perceptions of various learning aspects such as communication, critical thinking, and self-efficacy, through the validated survey instrument (CLECS 2.0) (Leighton et al., 2021). The research noted that students ranked TCE as the most important in meeting students’ learning needs, followed by F2FS, and the lowest. It can be seen that screen-based media are being used excessively by students.
What sample was used in the study? Explain your answer and provide supporting evidence from the textbook or other resources.
The study used a convenience sample of 113 nursing students who had experience in all three clinical learning environments (TCE, F2FS, SBS) from January-June, 2020. The sampling method was snowball sampling by using social media and the teacher’s network. A total of 174 students responded, but 61 did not participate because they had not answered all of the CLECS 2.0 questions. According to the principles of nursing research, convenience sampling is used in educational research because of the accessibility (Sexton, 2022). This approach provided a quick way for students to access during the pandemic, but likely led to some bias because it was not random or controlled for the diversity of the participants.
What population does this sample best represent? Explain your answer and provide supporting evidence from the textbook or other resources.
The sample is the most representative of undergraduate nursing students who went through varied clinical learning environments during the COVID-19 pandemic. There were many strengths regarding the sample; they were all citizens of the United States, Canada, and Japan, and included students at varying levels of a nursing program. A sample is representative of the population from which it has been drawn if it has similar characteristics to the population of interest (Sexton, 2022). This sample was representative of the target population of nursing students; however, it was not randomly selected and was not broadly nationally representative nor internationally representative.
Identify at least one variable examined in this study. Classify this variable as quantitative or qualitative. Explain your answer and provide supporting evidence from the textbook or other resources.
An obvious variable investigated in the research is the “perceived effectiveness of the clinical learning environment by students” (TCE, F2FS, SBS). This was measured on a Likert scale of 1 (not met) to 4 (well met) on the 29 learning items in the CLECS 2.0. It is a quantitative variable since it is measured numerically and can be subjected to statistical analysis. According to the authors, quantitative variables are variables that can be counted or measured and are typically analyzed using statistical methods (Bauer et al., 2021). The numerical answers to this variable make statistical comparisons possible among the three learning settings, hence it is a quantitative variable.
Explain the level of measure for the variable identified in Section 4. Explain your answer and provide supporting evidence from the textbook or other resources.
The variable students’ perceived effectiveness of the clinical learning environment is measured at the ordinal level. The research involved a 4-point Scale of Likert-type scale (1 = not met, 4 = well met), where the distance between the responses is not supposed to be equal, but the responses are ordered. For Sexton (2022), ordinal data are the categories that have an order, with the distances between the categories not set or known. Even though the responses are assigned numbers, the fact that the difference between 2 and 3 is not necessarily equal to the difference between 3 and 4 attests to the fact that it is ordinal data.
Determine if the study is overall a quantitative or qualitative study. Justify your reasoning using at least two key aspects for the type of study you chose. Explain your answer and provide supporting evidence from the textbook or other resources.
The research used is quantitative. Firstly, it involved a structured survey (CLECS 2.0) including numerical answers to collect information about the perceptions of the students. Second, statistical analysis of the data was carried out using these tests, including the Friedman test, which is appropriate for nonparametric repeated-measures analysis. Bauer et al. (2021) define quantitative research as “the collection of numerical data and the application of statistical analysis to seek solutions to the research questions. The research team was interested in the comparison of mean scores in different environments as opposed to delving into open-ended responses and personal stories, which serve as another indicator of its identification as a quantitative descriptive study that is concerned with the measurement of results.
Part 2 — Data Analysis
Creating Graphical Displays of Data
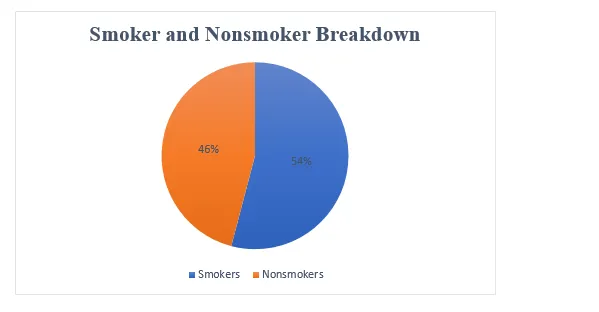
This graph shows that the numbers of smokers and non-smokers are almost equal – 46% smoking and 54% not smoke. It indicates that both groups are relatively proportionate in the sample concerning the comparison of BMI.
Histogram

The histogram provides an approximation of the distribution of BMI values in terms of frequency, using frequency classes of width 2. The histogram shows that the BMI values in the data set are clustered around the value of 30, with more overweight individuals in the population sample of the overweight to borderline obese groups.
Box Plots
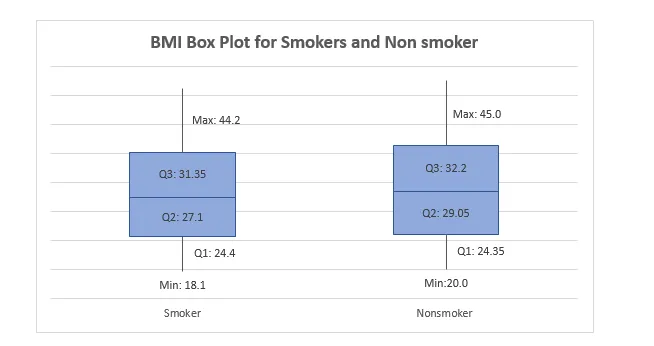
Based on the box plots, it can be seen that nonsmokers are more likely to have a higher median BMI (29.05) as well as the wider interquartile range (Q1 = 24.35, Q3 = 32.2) than smokers (median = 27.1, Q1 = 24.4, Q3 = 31.35), which implies that nonsmokers are generally less homogenous in terms of BMI. According to the descriptive statistics and box plots, we can make the conclusion that nonsmokers have higher values of BMI (mean = 29.11, median = 29.05) in comparison to smokers (mean = 28.00, median = 27.10). The variation of nonsmokers is also high (standard deviation = 6.11), and that of smokers (standard deviation = 5.37) is also high. These disparities indicate the possibility of the links between the level and distribution of BMI and smoking status.
Descriptive Statistics
Smokers BMI | Nonsmoker BMI | |||
Mean | 28.00 | Mean | 29.11 | |
Standard Error | 0.93 | Standard Error | 1.15 | |
Median | 27.10 | Median | 29.05 | |
Mode | 29.60 | Mode | 29.40 | |
Standard Deviation | 5.37 | Standard Deviation | 6.11 | |
Sample Variance | 28.79 | Sample Variance | 37.27 | |
Kurtosis | 1.32 | Kurtosis | 0.37 | |
Skewness | 0.66 | Skewness | 0.66 | |
Range | 26.10 | Range | 25.00 | |
Minimum | 18.10 | Minimum | 20.00 | |
Maximum | 44.20 | Maximum | 45.00 | |
Sum | 923.90 | Sum | 815.00 | |
Count | 33.00 | Count | 28.00 | |
Confidence Level (95.0%) | 1.90 | Confidence Level (95.0%) | 2.3673905 | |
Comparing Date
- Which group has a BMI that is typically higher? Be sure to write at least one sentence justifying your reasoning including values from the Excel output.
The BMI of the nonsmoker group is, on average, higher (29.11 and median 29.05), compared to the data of the smoker group, 28.00 and median 27.10.
- Which group has greater variation in their BMI? Be sure to write at least one sentence justifying your reasoning including values from the Excel output.
The data also shows that the nonsmoker group has both a higher mean BMI and a higher standard deviation (6.11) and sample variance (37.27) than the smoker group (5.37 and 28.79, respectively)
- .Do you suspect any outliers are present in the BMI for each group? Be sure to justify your reasoning.
Yes, there could be outlier(s) in each set. For example, the range of minimal BMI and the maximum value among smokers are 18.1 and 44.2, respectively, and among nonsmokers, the ranges are 20.0 and 45.0, meaning that the minimal and maximal values are extreme ones that may be considered outliers within the ranges of the boxplots.