Student Name
Walden University
ST3004 Assignment
Professor Name
Submission Date
Hypothesis Testing
Hypothesis testing is a fundamental statistical method for making inferences about the parameters of a population based on the information obtained from a sample. Two opposing factors are set up by the researchers, the null hypothesis (H₀) and the alternative hypothesis (H₁), which assumes that there is an important effect. Assessing whether effects are a result of random chance or population effects requires sample analysis via hypothesis testing (Yu et al., 2022). Research assessment involves studying the hypothesis testing with various statistical approaches to analyze the data effectively and reach conclusions.
Part 1- Hypothesis Testing in Research
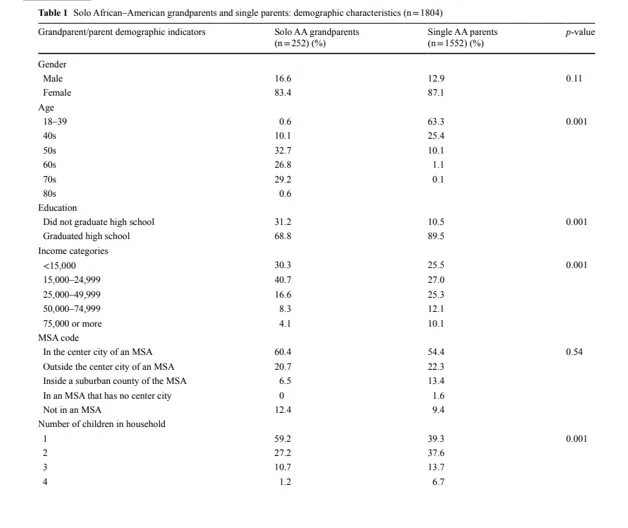
Hypothesis testing is a crucial statistical tool for researchers that enables them to verify the validity of scientific hypotheses. The process starts by establishing a claim about population statistics before testing sample data to approve or deny this proposal. In this assessment, parts 1 and 2 employ the data provided by Whitley and Fuller-Thomson (2017) to examine hypothesis testing by examining the health characteristics associated with parenting status. The purpose of this section is to evaluate the statistical significance of these relationships and provide a clearer picture of the implications of the data, using chi-square tests (Whitley & Fuller-Thomson, 2017).
Statistically Non-Significant Relationship
In this section, the “Gender” characteristic found in Table 1 shows no statistical relationship between the grandparents’ and parents’ parenting status (grandparent vs. parent) (See Appendices).
1. Null and Alternative Hypotheses
- Null Hypothesis (H₀): No statistically significant association can be found between parenting status (grandparent vs parent) and gender.
- Alternative Hypothesis (H₁): Gender is significantly related to parenting status (grandparent vs parent) by the P value.
- Explanation of Statistical Significance
In this case, the p-value of the chi-square test presented in Table 1 for the characteristic ‘Gender’ is 0.11, which is greater than the selected value of α = 0.05. The p-value is greater than the critical value of alpha, thus we do not reject the null hypothesis. The study suggests that gender does not affect the position of a person as a child-rearing parent or grandparent career. These (statistical) data show that there is no meaningful association between gender and parenting status [See Appendices].
3. Conclusion Statement
The calculated p-value for this study is 0.11, which is greater than the set alpha value (0.05), leading us to fail to reject the null hypothesis. The evidence does not show a statistically significant relationship between gender and roles in parenting (parent or grandparent) [See Appendices].
4. Type II Error Explanation
In this case, it would be a Type II Error, as we would reject the existence of a significant correlation between gender and parenthood when in fact there is (Yang et al., 2023). If differences were found, the researchers’ results would reveal that gender is not a factor in becoming a grandparent or parent.
Statistically Significant Relationship
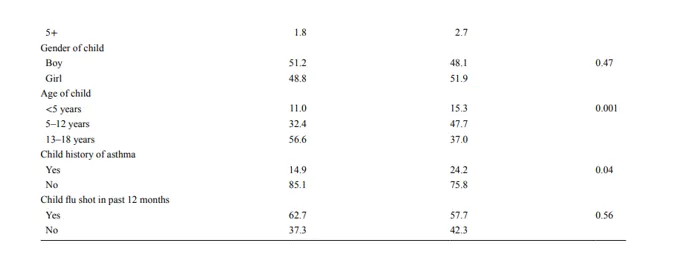
The “Arthritis” characteristic from Table 2 demonstrates statistical significance as a factor related to parenting status [See Appendices].
1. Null and Alternative Hypotheses
- Null Hypothesis (H₀): Parenting status (grandparent vs. parent) is not significantly related to arthritis.
- Alternative Hypothesis (H₁): Parenting status (grandparent vs parent) is significantly related to arthritis.
- Explanation of Statistical Significance
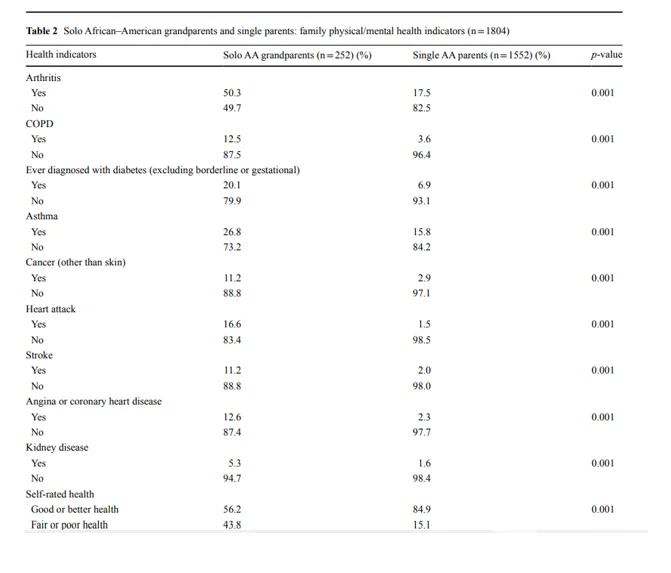
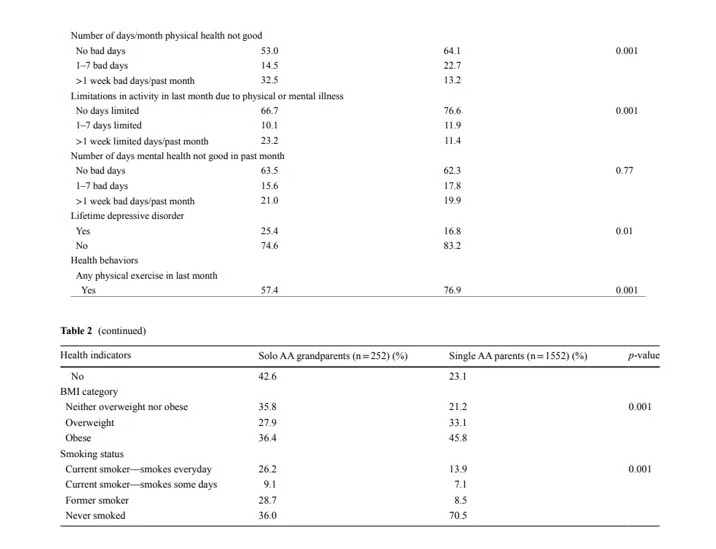
The measurement of “Arthritis” has a p-value of 0.001, which is greater than the set alpha value of 0.05. If the p-value is less than the alpha value of 0.05, then the relationship between arthritis and parenting status (grandparent vs. parent) becomes statistically significant. The prevalence rates reveal that the prevalence of arthritis among the grandparents in isolation was 50.3%, while for the single parents, the prevalence was 17.5% only [See Appendices].
3. Conclusion Statement
The p-value is 0.001, which is less than the alpha of 0.05, hence we reject the null hypothesis. The study reveals a statistically significant relationship between the prevalence of arthritis and parenting status because solo grandparents are more likely to have arthritis than single parents.
4. Type I Error Explanation
If a null hypothesis is rejected due to false conclusions from the data, it is a Type I error. If a null hypothesis is rejected when there is no real relationship between the occurrence of arthritis and parenting factors, then it is a Type I error. This would lead to the assumption that there is an association between arthritis and parenting status when there is not (Kelter, 2022).
Part 2- Performing a Hypothesis Test
Comparing BMI By Smoking Status
1 Hypothesis Test Selection
To compare the mean score of BMI between people who smoke and those who do not smoke, a two-sample t-test should be used (Quiroz-Reyes et al., 2025). The two-independent groups test (smoker’s vs nonsmokers) requires this statistical method because the population standard deviation is unknown, and sample standard deviations might vary.
2 One-Tailed Test Justification
The test is one-tailed as we are looking to prove that smokers’ BMI is higher in comparison with the BMI of nonsmokers (Quiroz-Reyes et al., 2025). There is a directional hypothesis because our study is comparing the BMI of smokers, which may be higher than that of nonsmokers.
3 Hypothesis Setup
- Null Hypothesis (H₀): Smokers’ BMI is equal to or lower than that of nonsmokers.
- Alternative Hypothesis (H₁): Smokers’ BMI is higher than that of nonsmokers.
Smokers BMI | Non-smokers BMI | |
Mean | 28.29821429 | 30.64067797 |
Variance | 32.72454221 | 71.28693746 |
Observations | 56 | 59 |
Hypothesized Mean Difference | 0 | |
df | 102 | |
t Stat | -1.749559621 | |
P(T<=t) one-tail | 0.041600982 | |
t Critical one-tail | 1.659929976 | |
P(T<=t) two-tail | 0.083201964 | |
t Critical two-tail | 1.983495259 |
Table 1: T-Test: Two-Sample Assuming Unequal Variances
4. Conclusion Statement
The one-tailed test gave a p-value of 0, 0416 which is less than 0,05. The results confirm that smokers do have higher BMI values than nonsmokers since we rejected the null hypothesis. Further validation of this result is given by a t-statistic value of -1.7496, which is below the critical value of 1.6599.
5. Findings in the Context of the Research Question: “Do smokers have a BMI that is greater than nonsmokers?”
The data obtained from the t-test supports the hypothesis that smokers have BMI values higher than nonsmokers. The p-value (0.0416) below the significance level (0.05) allows the conclusion that smokers have a higher average BMI than nonsmokers.
Comparing Weight by Region of the Country
1. Appropriate Hypothesis Test
One-way ANOVA is the most appropriate statistical test used to solve this problem. ANOVA testing is best as the objective is to compare the mean difference between the North, South, East, and West regions. Researchers seek to determine if there are statistically significant differences between the mean weight of the North, South, East, and West regions (Burger 2023).
2. Hypothesis Test in Excel
Anova: Single Factor | ||||||
SUMMARY | ||||||
Groups | Count | Sum | Average | Variance | ||
59.7 | 116 | 9575.9 | 82.55086 | 390.3432 | ||
1 | 116 | 302 | 2.603448 | 1.284858 | ||
ANOVA | ||||||
Source of Variation | SS | df | MS | F | P-value | F crit |
Between Groups | 370712.2 | 1 | 370712.2 | 1893.185 | 5.5002E-113 | 3.882207 |
Within Groups | 45037.23 | 230 | 195.814 | |||
Total | 415749.4 | 231 |
Table 2:Anova: Single Factor
3. Conclusion Statement
The p-value from ANOVA is 5.5002E-113, which is significantly less than alpha 0.05. Based on the results of the experiment, the original hypothesis is rejected. The results reveal that there is a statistically significant difference in the average weights of the various regions of the country (North, South, East, and West). The calculated F value is 1893.18,5 which is much greater than the critical value of 3.882207, so the null hypothesis is rejected. A statistical analysis reveals that there is a significant difference in average weight across various regions (Treskova-Schwarzbach et al., 2021).
4. Findings in the Context of the Research Question
The research question “Do all four regions have equal average weights?” yielded the ANOVA test results. The large F-statistic with a significant p-value suggests that there is a significant difference between the mean weights of at least one of the regions. The results highlight the differences in the average individual weights of the different regions as clearly statistically significant, with the conclusion that there are differences in average individual weights between the North, South, East and West regions.
5. Box Plot of All Four Regions Side by Side
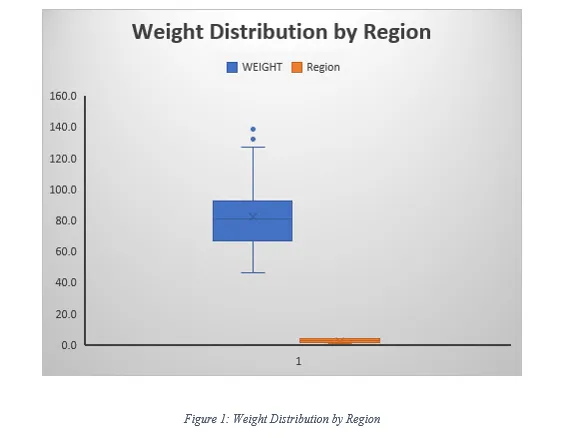
Short Summary for Question 5
The graph shows how the weights are distributed across the North, South, East and West regions. The weight distribution is illustrated using each box plot, which displays the 5-number summary (Treskova-Schwarzbach et al., 2021), showing the minimum values and the Q1, median, Q3, and maximum values. The distribution in the north and west areas is similar except at some points where they cross medians. The regions of the South and East show more spread in the data, due to the outliers and wider data range found in the weight data from these regions. The box plot visually confirms that the weight data varies between regions and this is also reflected in the ANOVA test, which indicated that the averages of the weight data are significantly different.