

Student name
Capella University
MHA-FPX5017 Data Analysis for Healthcare Decisions
Professor name
Submission date
Descriptive Statistics and Data Visualization
When it comes to improvement, no aspect of the health care system is more critical than the ability to use statistical analysis to pinpoint the areas that need improvement. Research data needs to be reliable and consistent, which can be achieved by having a reliable statistical analysis system (Panos & Boeckler, 2023). This assessment involves using statistical and graphic representation techniques to measure health care organisation’s readmissions to determine overall performance. All necessary calculations have been done in Microsoft Excel, with the correct formulas in place and the output data has been analysed suitably using the Analysis Toolpak. Also, the findings of this analysis and the way it matched those of the published literature have been explained.
Descriptive Statistics Test
The descriptive statistics are very important in a quantitative study, when summarising and describing key characteristics of the data sets. Any Descriptive Statistics will be required to have a detailed description of sample for a comprehensive understanding of the characteristics of the sample (Fulk, 2023). The difference between the central tendency measures (mean and median) of the readmission rate is very small (0.1060, 10.60% vs 0.1045, 10.45%) and the descriptive statistics indicate that the readmission rate is symmetrically distributed around the center. The Standard deviation is equal to 0.0487 which is referred as moderate spread rate of readmission per 70 month, the variance is 0.0024 which indirectly shows that the data points are spread moderately. By using data analysis, healthcare organizations can get insights into performance trends and take focused interventions (Negash & Hanum, 2025). The interquartile range of 0.2002 suggests there is a lot of variation in the data; the bottom 25% of the data is below 0.0072 and the top 25% is above 0.2073. The skewness value was almost negative (-0.0143) and kurtosis value was negative (-0.6387) indicating that the distribution of the scores was nearly symmetrical but flatter than a normal curve, indicating during the period of observation there were no extreme outliers and readmission was consistent. Table 1 below shows the results of descriptive statistics of readmission rates.
Table 1
Descriptive Statistics for Readmission Rates
Statistic | Value |
Mean | 0.1060 |
Standard Error | 0.0059 |
Median | 0.1045 |
Mode | N/A |
Standard Deviation | 0.0487 |
Variance | 0.0024 |
Skewness | -0.0143 |
Kurtosis | -0.6387 |
Range | 0.2002 |
Minimum | 0.0072 |
Maximum | 0.2073 |
Data Interpretation and Summary
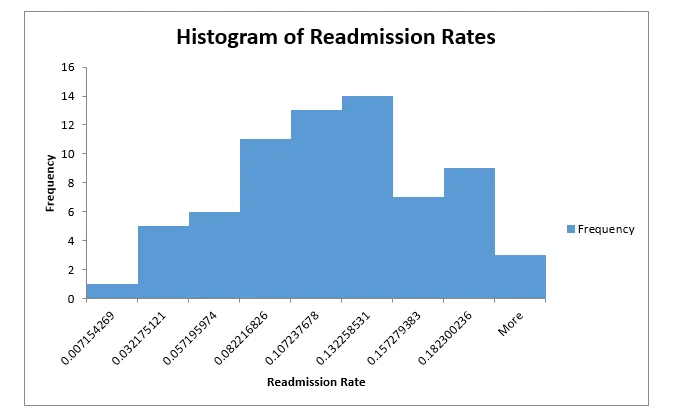
Histograms are a very helpful visual aid that can describe the frequency distribution of continuous data for specific intervals/bins. The use of histograms and other data analysis tools helps identify some interesting patterns, such as skewness, outliers, and grouping of observations, which may not be apparent from the numerical summaries alone (Pannell, 2023). The histogram shows a unimodal distribution with the largest frequencies in the middle ranges (between 0.107 and 0.132), with 27 observations at the upper frequency limit of the middle range, which is the peak of the distribution, and has a roughly bell-shaped form. With visual healthcare data, patterns and anomalies in clinical data are easily identified (Horiachko, 2023). The distribution is more or less symmetrical, with 11 observations in the 0.082-0.107 bin to the left of the main peak and 14 observations in the 0.132-0.157 bin to the right of the main peak. The frequency gradually goes down on both tails as only one value was observed in the lowest bin (0.007) and three were observed in the highest bin (greater than 0.182), showing that there were few extreme values. The distribution of most monthly readmission rates is within a predictable range (8-15%), which, in conjunction with the descriptive statistics results of minimal skewness and moderate variability, indicates that there is some consistency in readmission patterns and the distribution has a normal shape. The histogram in Figure 1 below displays the distribution of the frequencies of the readmission rates.
Figure 1
Histogram of Readmission Rates
Recommendation and Plan of Action
The mean readmission rate obtained from the data analysis was 10.60%, and the SD was 0.0487, which shows that there is a significant variation, so the nursing home administration should have an extensive readmission reducing strategy offering care and management of transition, and follow-up strategies after discharge. Evidence-based interventions included studies showing that structured transition programs can help decrease hospital readmissions, with better care coordination being one of the most effective interventions (Pugh et al., 2021). The plan of action should involve putting together a 48-hour post-discharge phone call protocol to be able to catch early complications, as well as implementing medication reconciliation to avoid adverse drug events, and creating individualized care plans along with specific instructions for discharge with high-risk residents (Bhandari et al., 2022). Because of the histograms showing 29% of the observations (20 months) are above the median readmission rate of 10.45%, targeted interventions should focus on the months with higher readmission rates. By monitoring on a regular basis and analysing the data on a monthly basis, it will be possible to make proactive adaptations to intervention strategies, leading to better outcomes for residents and lowered costs of healthcare due to preventable readmissions (Po et al., 2024).
Conclusion
The average of this 70-month evaluation of the readmission data is 10.60 with a moderate standard of variation and near normal distribution trend. There was a similar pattern on the visualization (histogram) and the descriptive statistics for readmission with a few outliers, indicating that patterns of performance were predictable. Implementation of evidence related interventions (transitional care: post-discharge follow up plan and medication reconciliation) will be a strategic approach to reducing readmission rates. Both control and evidence based updates are done monthly, so that there is a continuous positive impact on the outcomes of the residents and the optimal use of healthcare resources and cost-effectiveness.