
Student Name
Capella University
MBA-FPX5008 Applied Business Analytics
Professor Name
Submission Date
[blur_section id=”postinstructions” button=”Free Download” form_id=”fdfac57″]
Interpreting Graphical Representations of Data in Articles
Slide 1
Greetings, my name is___and today I will conduct an analysis of trends in the global scene and in smartphone markets using Q3 2025 industry reports.
Slide 2
The implications here are connected with the variables under assessment and determining the limitations that can be experienced when using results in the broader business context (Calder et al., 2021). The end product of scrutinizing the visual information leads to informed decision-making, and this is backed by the quantitative presentation of information that goes beyond numbers to such insightful forms as to support in developing strategic plans.
Slide 3
Organization Background
The circumstances of the organization have to be familiar in order to achieve a clear picture of the data of the business and make a wise strategy. The industry of personal computing has been revolutionized through product design and, in the case of Apple Inc., a company founded in 1976, under the vision of Steve Jobs and Steve Wozniak. It was during a period of unparalleled growth where the company was valued at over 4 trillion by October 2025 (Britannica, 2025). Apple’s business model is focused on the fact that the increased prices, the system of hardware-software, and brand loyalty in foreign markets (TechInsights, 2025). The company background analysis in detail gives the reasons by which it is possible to contextualize the data-defined conclusions and the measures of performance.
Slide 4
Relevance and Importance of the Information
Evidence-based decision-making has taken center stage in creating a competitive advantage in the modern business world in all industries. This is observable in the scale of shipments of smartphones, which has attained 320.1 million in 3 rd quarters of 2025 (Omdia, 2025). Market intelligence would enable the vendors to identify where the region would grow more and, in particular, amongst emerging markets like India and Africa (Omdia, 2025). Companies with broad data analysis can strategize to respond in a strategic way to both the market dynamics and the demand trends. Proper information is also important in creating responsive approaches that are in line with the changing market conditions and prospects.
Strategic business planning is a service that needs good data to make predictions, to effectively use resources, and to remain competitive in the organization. According to IDC, this means that the smartphone market around the world will grow by 1 per cent in 2025, which is due to the development of the high-end market (IDC, 2025). The insights of these growth patterns can assist manufacturers to focus on models that are profitable and obtain channel funding to position them optimally in the market (Omdia, 2025). Good allocation of resources is made using information on consumer behavior, adoption of technology, and performance per region to develop products. Firms that leverage such powerful data analysis packages are at the peak of an ever-ruthless and competitive market.
Slide 5
Source of Data and Limitations
The sources of data are vital in determining the validity and usefulness of their research in research validity and usefulness in business. The main source is Omdia, a well-known market research company that provides information on the analysis of the technology industry and its forecasting (Omdia, 2025). OMdia had gathered the data on shipments of smartphone vendors in various regions of the planet in Q3 2025, and the figure of 320.1 million units was tracked (Omdia, 2025). The additional data from IDC is used to gain more information about the market and contains forecasts of the increased usage of GenAI smartphones, as well as the regional demand (IDC, 2025). High-quality data sources stimulate good business studies because they permit the execution of evidence-based decision-making.
Despite a proper data collection research design, there are certain weaknesses that affect the level and validity of market research findings. The analysis focuses more on the Q3 2025 performance, which was not able to reflect the longer-term trends and seasonal performance. The parts-level shortages and the increased prices were transformed into a challenge in the industry, which could have an implication on the accuracy of deliveries and predicting prices in the future (Omdia, 2025). Regional data that masks local market heterogeneity in local markets could be evident in heterogeneous new markets like India and Africa. The consciousness of the data constraints will almost inevitably lead to realistic interpretations and guard against overconfidence when it comes to predicting and modelling strategic planning.
Impact of Data in Business Context
Slide 6
The innate character of data analytics is that it influences the process of formulating strategy options on the basis of actionable information, which leads to resource mobilisation and resource positioning. Apple used data in marketing to adopt aggressive pricing in China that was contrary to its operations in the older versions of the iPhone, which were discounted (TechInsights, 2025). To cope with the level of competition, Samsung enhanced its Galaxy A in the emerging markets where new functionalities were added (TechInsights, 2025). This was due to the fact that the shipment information in the area allowed vendors like Transsion to increase its market share in the African market by 25% every year as the company fine-tuned its inventory (Omdia, 2025). Evidence-based decision-making supports organizations to be vibrant in response to market forces as well as to make sure that their competitive strategies are at optimum.
Market intelligence is a timely parameter of significant business such as product launch, pricing plans, and location trail of expansion with the manufacturers. The companies identified less than a hundred dollars as the primary low-end segments and had over seven hundred dollars as the primary high-end segments and adjusted portfolios to those (Omdia, 2025). In order to stay income-driven in the context of increasing costs, companies focused on high-priced, high-value-added models and maintained defensive positions in the mid-range segments (Omdia, 2025). The IDC forecasts revealed that 370 million GenAI-powered smartphones would ship by 2025, and this would require suppliers to be clever when implementing artificial intelligence capabilities (IDC, 2025). The thorough exploitation of the data will see the companies invest in product development and marketing as well as supply chain decision-making based on new opportunities.
Graphical Representation and Interpretations
Slide 7
Chart 1 Interpretation
Figure 1
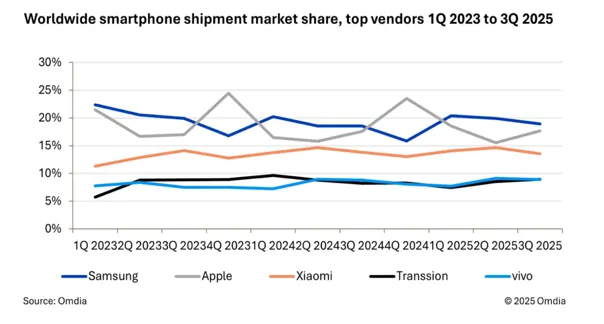
The line chart shows the market share of the five largest sellers of smartphones in the world in eleven quarters of a year. There was stable leadership of about between 19-22 but very volatile in Samsung during the period of the study (Omdia, 2025). Apple was extremely volatile, having the highest percentage of 24 percent and then an approximate of 18 percent estimated in Q4 2023 and Q3 2025, respectively. Xiaomi also enjoyed a steady growth of 11 percent and 14 percent compared to Transsion and vivo who had a steady growth of 7-9 percent in the market (Omdia, 2025). The chart also shows that competition among the vendors, with Samsung’s market share of close to 19.9%, is on an increasing trend even as it is pressured by new market entrants (DemandSage, 2025). This sketch illustrates the nature of the shifts in market leadership in terms of the shifts per quarter, which show buying behavior of the season and strategic responses of competitors.
Slide 8
Chart 2 Interpretation
Figure 2
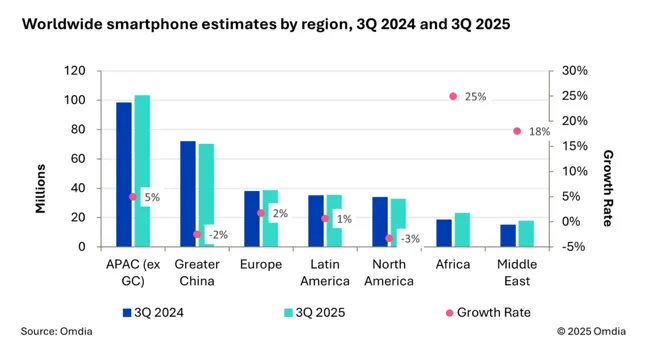
It is a combination bar-line chart that shows the number of Smartphones shipped in each region each year and the growth/shipment rate in each of the seven markets per year. The highest growth rate ever was also in Africa, where the units shipped rose by an average of 18 million to 22 million (Omdia, 2025). The strongest segment was the Asia-Pacific (excluding Greater China) of more than 100 million units, and the market increased by 5 percent with such a big market size (Omdia, 2025). North America only saw an increase of up to 3%, and Greater China up to 2 percent, which signifies saturation of the market and headwind of the economy, respectively (Omdia, 2025). This was witnessed in Africa, where it improved its performance as the inflation rate decreased, and stability both in the currency and increased financing of devices was achieved in these new markets such as Kenya (Canalys, 2025). This graph is an indication of the way in which the emerging economies, and to a greater extent Africa and the Middle East, have been counterbalancing the decline in the developed economies.
Slide 9
Importance of Data Analysis in Business Context
The capability to break down information is the fundamental factor of success of companies in the competitive technological market where consumer preference changes at a high rate and where geographic variations exist. The vendor market share analysis indicates that Samsung and other firms have to constantly track the competitive positioning in order to keep ahead of new competitors (Omdia, 2025). As shown in the regional shipment data, the African markets have increased by 25 percent and North America by 3 percent, and they demand conscious choice-making of the resources (Omdia, 2025). The interpretation of these trends can assist manufacturers to maximize their product portfolios, pricing strategies, and the time to enter the market so that maximum profitability can be realized (TechInsights, 2025). Its extensive data analysis is the pathway to sustainable competitive advantage and identification of new opportunities in developing worldwide markets.
Slide 10
Summary and Recommendations
Integration of output of various sources of information results in real intelligence that is capable of making successful strategic decisions in a new market environment on a global scale. The graphical data indicate that the competition is on the rise among top vendors, and market share is apportioned to 15-20 percent among the top vendors (Omdia, 2025). Region-wise, Africa and Asia-Pacific are the growth drivers of the industry in the next 2025: The industry is not the most attractive in terms of markets, with Africa and Asia-Pacific being the most significant growth drivers of the industry (IDC, 2025). The suggestions to vendors are to concentrate on the development of new markets and the development of region-specific pricing and quicker product introductions towards the seasonal peaks in Q4 (TechInsights, 2025). Such evidence-based proposals allow firms to optimize the potential of the operations against the registered market potentials, in the development paths towards sustainability.
Slide 11
Additional Information Needed and Next Steps
Although the existing visualizations are helpful in understanding the market in a broad way, a number of essential data dimensions need exploration to have an in-depth strategic plan. The performance data on country-levels of each region would showcase some of the high-potential markets that will require investment and employment locally (Canalys, 2025). The price segment analysis of ultra-low devices’ performance, mid-range, and premium devices would be used to bring out the profitability vs. volume trade-offs (Omdia, 2025). The consumer sentiment statistics, retail sell-through rates, and stock quantity would show that the quantity of deliveries is a fair estimation of the final-user demand. To come up with more accurate forecasting models and resource allocation schemes, organizations need to have thorough market research to fill these gaps.
Slide 12
Conclusion
Effective visual data representation deciphers provide business leaders with evidence-based strategic decision-making capability to manoeuvre in intricate competitive landscapes. The analysis of the smartphone market reveals how the trend of vendor performance of the vendors and regional growth patterns may be combined to signify actionable opportunities in the emerging economies. With an organized enquiry into the data that is gathered, organizations gain competitive gains since they can establish competitive advantages since they can identify market trends before their competition. Further investment in the analytical functionalities and data collection methodology is required in order to stay ahead of the curve in the dynamic technology realms.
[/blur_section]