

Student Name
Capella University
MBA-FPX5016 Operations Management for Leaders
Professor Name
Submission Date
[blur_section id=”postinstructions” button=”Free Download” form_id=”fdfac57″]
Process Improvement Plan
Process improvement planning is a systematic way to discover inefficiencies and strategically make process improvements to the system. Such an organized system makes use of data analysis to review existing operations and come up with opportunities to improve systematically. The plan documents the status quo of the processes, compares performance indicators, and offers practical solutions for organizational excellence (Gomaa, 2025). The more satisfied the customer, the more competitive the operations, and the more the operations cost, the more the process improves.
Process Flowchart Assessment
A flowchart of the espresso drink preparation is the systematic representation of eleven working steps that take place in order, from taking orders to the delivery of the drink to the customers. The given visualization creates several crucial control points such as quality checks, payment processing, and decision-making on the beverage composition (Vasudevan and Chengaiyan, 2024). Flexibility in processes with the choice of decision nodes between milk- and non-milk-based drinks in the flowchart. The major process tasks are bean grinding, extraction of espresso, steaming of milk, and the final quality check measures.
Figure 1
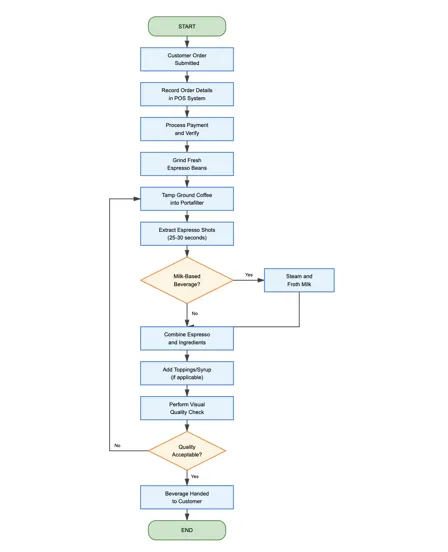
Process flowchart
Espresso Beverage Preparation Process Procedure
Purpose of Procedure
The process sets up standard procedures regarding the preparation of espresso drinks in the locations of Wild Dog Coffee Company. The documented process enables quality consistency, efficiency of operations, and optimum customer satisfaction at all service points. Standardization reduces differences in the quality of products and allows for successful training when recruiting new barista team members (Rogalewicz et al., 2023). It enables the development of a business plan to achieve operational excellence that can be replicated in making beverages.
Performance Metrics
The effectiveness and efficiency of the process of preparing the espresso drinks are evaluated by three key performance indicators. Order delivery time monitors the hours between the delivery of orders and the delivery to the customers. The best customer satisfaction is 2-3 minutes below the target order delivery time. Consistency in beverage temperature guarantees that drinks are delivered at a temperature range of 150-165 degrees Fahrenheit. First-time quality refers to the percentage of beverages that are not reworked or corrected (Taifa et al., 2021). For the first time quality is expected to remain above 95 percent for efficient running of operations and to meet the standard.
Measurement Methods
The point-of-sale system records the order delivery time automatically by utilizing inbuilt timestamp functionality. Calibrated infrared thermometers are used to measure beverage temperature right before handoff, as a specification requirement (Scheucher et al., 2022). First-time quality rate is determined by dividing the number of successful orders by the number of orders and multiplying them by 100. These metrics are summarized in the form of daily performance reports to determine trends, patterns, and areas of continuous improvement.
Procedure Steps: Order Processing
The barista takes the order and inputs the customer order into the point-of-sale system with the right specifications. Processing and verification of payment and subsequent beverage preparation are started in order to achieve accuracy of the transactions. New espresso beans are weighed and ground to the right level of fineness so that the quality of extraction is best (Vasudevan and Chengaiyan, 2024). The tamped ground coffee is evenly distributed and compacted to a consistent pressure of approximately 30 pounds in the portafilter.
Procedure Steps: Beverage Preparation
The portafilter is inserted into the espresso machine and allowed to sit there for a total of 25 to 30 seconds to allow the water to extract the espresso. In the case of milk-based drinks, whole milk is steamed to the desired temperature, with microfoam texture being produced. Espresso is usually made by adding steamed milk or any other ingredients to it, depending on the recipe of the beverage. Toppings, syrups, or garnishes are optional and added depending on the customer preference and the normal recipes.
Procedure Steps: Quality Control and Delivery
A visual quality check is carried out to ensure that the beverage appears, contains the required volume of beverage, and is presented appropriately before being served to the customer. Items that are not up to quality are re-prepared at once to ensure that the company doesn’t lose its reputation of being the best. The final product is the beverage, which is passed to the customer, and the correctness of orders is verified. POS system records the time once the order is fulfilled, which will be utilized to determine the total order delivery time (Scheucher et al., 2022).
Statistical Data Analysis for Process Changes
Process Centering Analysis
The process of making a beverage shows that there is proper centering with a mean service time of 2.478 minutes. The acceptable range limits set the time in which the target specification midpoint is set. The process mean has only a deviation of 0.022 minutes compared to the target and, therefore, the overall centering performance is excellent. This small difference shows that the process is moving toward the desired value at a particular time.
Process Capability Assessment at Three-Sigma
The process capability index (Cpk) is determined as 0.2699, which is much lower than the industry standard of 1.33. The potential capability (Cp) is 0.2823, meaning that there is not enough capability to allow for a range of specifications. Both Cpu (0.2948) and Cpl (0.2699) are considerably lower than a reasonable capability, and require immediate solutions. The process is not consistently capable at the three-sigma level and regularly generates defects that are even beyond specification limits.
Statistical Control Chart Evaluation
There are lower and upper specification limits of 2.00 and 3.00 minutes, respectively, that provide a one-minute tolerance. The specification range is seen to be insufficient considering the present variation of the process of about 0.59 minutes standard deviation. The specification range of 2-3 minutes is currently considered acceptable, with most observations at rates of about 32 percent. This performance shows that there are major problems in terms of quality that need emergency process improvement interventions and remedial measures.
Variation and Standard Deviation Analysis
The standard deviation of the known process of 0.5903 minutes is a relatively wide range compared to the specification range. The sample standard deviation is 0.5910 minutes, which is very close to the process variability baseline set for this process. This is a very large spread and will take up nearly 60 percent of the range of specifications and hence restrict the process capability. Eliminating variation is a requirement to attain decent process performance and customer satisfaction on a regular basis.
Specification Limits and Performance
There are lower and upper specification limits of 2.00 and 3.00 minutes, respectively, that provide a one-minute tolerance. The specification range is seen to be insufficient considering the present variation of the process of about 0.59 minutes standard deviation. The specification range of 2-3 minutes is currently considered acceptable, with most observations at rates of about 32 percent. This performance shows that there are major problems in terms of quality that need emergency process improvement interventions and remedial measures.
Process Improvement Urgency
The statistical analysis provides clear evidence that the beverages’ preparation must be improved in many aspects of quality. This absence of combination, combined with the lack of capacity, statistical volatility, and too much variation, is threatening operational quality and contentment (Gomaa, 2025). Redesign of the process should aim at minimizing variation, eliminating special causes, and possibly increasing specification limits. This will require an immediate corrective measure to make sure that successful expansion to the second location is working.
Cause-and-Effect Analysis of Process Variances
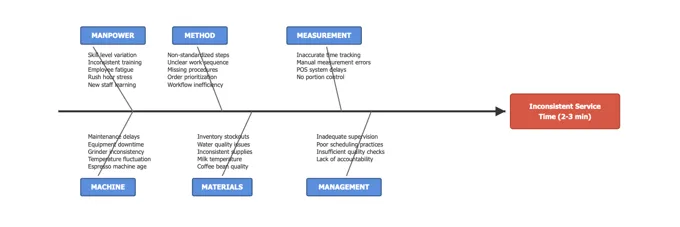
The cause-and-effect diagram is a thorough method that helps identify six key areas where the inconsistencies of beverage service occur. Factors related to manpower include variations in skill level, irregular training, employee exhaustion, and learning curves of new employees. Causes that lie with the method: Non-standardized preparation procedures; unclear work sequence; lack of consistency or effective work schemes on consistency. The machine factors involve the oldness of the espresso equipment, temperature differences, inaccuracies in the grinders, and inadequate preventive maintenance practices (Kumah et al., 2024). The materials category refers to variations in coffee beans, hot milk issues, supply issues, and stock-out issues. The measurement issues include inaccuracy in the tracking of time, human error in measurement, and delays in the point- of- sale system. The management aspects are poor supervision, bad scheduling, lack of quality checking, and accountability.
Analysis of manpower and method categories is possible, and it seems these are the largest sources of variation in service time. The experience of the barista will result in different speeds of preparation and quality of the coffee drinks. There are no standardized processes, so each individual can read the preparation instructions in their own interpretation, and it is directly responsible for the inconsistencies in time (Nahar et al., 2022). These problems are exacerbated by equipment-related aspects such as temperature control problems and drift of grinder calibration over time. All these factors can be interconnected with each other, making the pattern of the variances complex, and complex intervention will be required, addressing multiple groups.
Figure 2
Cause-and-Effect Diagram: Beverage Service Time Variation
Quality and Customer Service Improvement Recommendations
Use visual work instructions as part of an overall standardized operating procedure to reduce by 40 per cent the method-induced variation. Establish mandatory certification for baristas that has passed the competency test of espresso extraction, steaming milk, and quality standards. Install mechanical dosing and grinding machines to minimize machine errors and improve the predictability of preparation time. Increase the range of specifications to 1.5-3.5 minutes and, at the same time, decrease the variation in the process using the intentional training intervention (Nguyen et al., 2021). These improvements target root causes from the statistical analysis to increase capability and control. The introduction of real-time performance dashboards will also allow instituting corrective steps immediately in case of service time variances from the targets.
Documenting the procedures and standardizing training in the second locations should be done beforehand to ensure that operations are standard. To eradicate the temperature and grinding variation in machines, invest in preventive maintenance schedules and equipment upgrades. Implement daily quality checking and supervisor checking as control measures to accountabilities and discipline of the process (Lima et al., 2025). All these recommendations are directed at the poor value of Cpk = 0.2699 (needs improvement to 1.33 minimum). The cost of implementation is estimated to be 15,000-25,000 with high returns in terms of wastage minimization and satisfaction. 95 percent for the first-time quality and 2.5 minutes on average for service times are among such success indicators.
Conclusion
The statistical analysis shows that the preparation procedure of beverages in Wild Dog Coffee Company requires a great improvement before successful expansion. Without process capability, statistical stability, and too much variation are threats to operational excellence and profitability. The basis of consistent and high-quality service will be developed through the recommended standardization, training, and equipment improvement. These are the key interventions that help the second location follow in the footsteps of the first location without losing the competitive advantage and reputation.
[/blur_section]